In this post, we will look at how to use the unique function in R, which is a good tool for identifying and removing duplicate values in different data structures. We will first have a look at what the unique() function is and how it works. Next, we will look at some examples of how to use it on vectors, matrices, and dataframes, all common data structures in R. Furthermore, we will look at how to count the unique values in a data set and compare two or more data sets for unique values. By the end of this post, you will know how to use the unique function in R and how to apply it to your data analysis and visualization tasks.
Table of Contents
- Outline
- What is the unique() function in R?
- How to use the unique() function on vectors
- How to use the unique() function on matrices
- How to use R’s unique() function on dataframes
- How to count the number of unique values in a data set using unique()
- Summary
- Resources
Outline
In this post, we will first explain what the unique() function in R is and how it works. Next, we will show you how to use the unique() function on vectors, which are one-dimensional data arrays. Then, we will demonstrate how to use the unique() function on matrices, which are two-dimensional data arrays. After that, we will illustrate how to use the unique() function on data frames, which are special types of data structures that can store different data types in each column. Furthermore, we will teach you how to count the unique values in a data set using the length() function. By the end of this post, you will have a solid understanding of R’s unique() function and how to apply it to different types of data structures.
What is the unique() function in R?
The unique function in R is a built-in function that returns a vector, matrix, or data frame with only the unique values from the original data. The syntax of the unique() function is as follows:
unique(x, incomparables = FALSE, fromLast = FALSE, nmax = NA)Code language: R (r)The arguments of the unique() function are:
- x: the data to be processed. It can be a vector, matrix, or data frame.
- incomparables: a vector of values that are not to be compared. The default is FALSE, which means that all values are compared.
- fromLast: a logical value that indicates whether to scan the data from the last element or the first element. The default is FALSE, meaning the data is scanned from the first element.
- nmax: an integer that specifies the maximum number of unique values to be returned. The default is NA, which means that there is no limit.
The unique() function returns a vector, matrix, or data frame with the same attributes as the original data, but with only the unique values. The order of the values is preserved, unless the fromLast argument is set to TRUE. The unique() function also has a method for lists, which applies the function to each list element and returns a list of unique values.
How to use the unique() function on vectors
One of the simplest ways to use the unique() function in R is to apply it to a vector. A vector is a one-dimensional data array that can be numeric, character, logical, or complex. For example, suppose we have a vector of numbers called x:
x <- c(1, 2, 3, 4, 5, 1, 2, 3, 4, 5)Code language: R (r)Here is how the numeric vector, x, looks like:
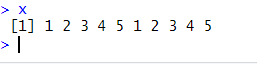
We can see that this vector has 10 elements but only five unique values. To get a vector with only the unique values, we can use the unique() function:
unique(x)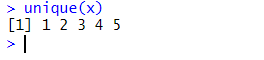
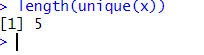
We can see that the unique() function returns a vector with only the unique values from x, in the same order as they appear in x. The length of the output vector is 5, which is the number of unique values in x. We can also use the length() function to check this:
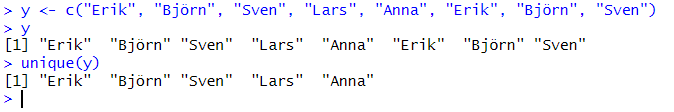
We can also use the unique() function on character vectors, logical vectors, or complex vectors. For example, suppose we have a character vector of names called y:
y <- c("Erik", "Björn", "Sven", "Lars", "Anna", "Erik", "Björn", "Sven")Code language: R (r)This vector has 8 elements, but only 5 unique values. To get a vector with only the unique values, we can use the unique() function:
unique(y)Code language: R (r)The unique() function returns a character vector with only the unique values from y, in the same order as they appear in y. The length of the output vector is 5, which is the number of unique values in y.
How to use the unique() function on matrices
Another way to use the unique() function in R is to apply it to a matrix. A matrix is a two-dimensional data array that can be numeric, character, logical, or complex. For example, suppose we have a matrix of numbers called z:
z <- matrix(c(1, 2, 3, 4, 5, 6, 1, 2, 3, 6, 5, 4), nrow = 3, ncol = 4)Code language: R (r)We can see that this matrix has 12 elements but only 6 unique values. To get a matrix with only the unique values, column-wise, we can use the unique() function and the MARGIN = 2 parameter:
unique(z, MARGIN = 2)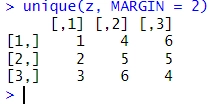
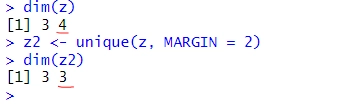
We can see that the unique() function returns a matrix with only the unique values from z, in the same order as they appear in z. The dimensions of the output matrix are 3 rows and 3 columns, which is the number of unique values in z. We can also use the dim() function to check this:
We can also use the unique() function on character matrices, logical matrices, or complex matrices. For example, suppose we have a character matrix of names called w:
w <- matrix(c("Erik", "Björn", "Sven", "Lars",
              "Anna", "Fredrik", "Erik", "Björn",
              "Sven", "Fredrik", "Anna", "Lars"), nrow = 3, ncol = 4)Code language: R (r)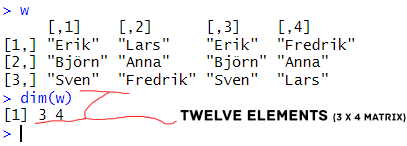
We can see that this matrix has 12 elements, but only 6 unique values. To get a matrix with only the unique values, we can use the unique() function. Here, with the t() function:
t(unique(t(w)))Code language: R (r)In the code chunk above, t() is used to transpose a matrix in R. We convert the columns into rows and rows into columns. This is done because the unique() function operates on rows when applied to a matrix. Using t() will allow unique() to identify and remove any duplicated columns.
Then, we use t() again to transpose the matrix back to its original orientation. This second application of t() restores the original row-column structure, but now without the duplicated columns.
How to use R’s unique() function on dataframes
A third way to use the `unique()` function in R is to apply it to a data frame. A data frame is a special type of data structure that can store different types of data in each column, such as numeric, character, logical, or factor. For example, suppose we have a data frame of students’ information called df:
df <- data.frame(name = c("Erik", "Björn", "Sven", "Lars", "Anna", "Erik", "Björn", "Sven"),
age = c(20, 21, 22, 23, 24, 20, 21, 22),
gender = c("M", "M", "M", "M", "F", "M", "M", "M"),
grade = c("A", "B", "C", "D", "E", "A", "B", "C"))Code language: R (r)
We can see that this dataframe has 8 rows and 4 columns, but only 5 unique rows. To get a dataframe with only the unique rows, we can use the unique() function:
unique(df)Code language: R (r)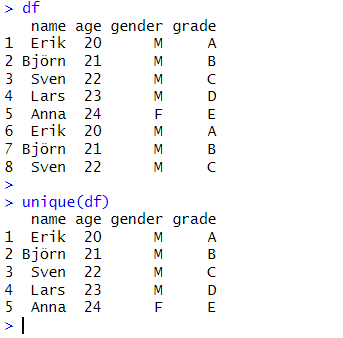
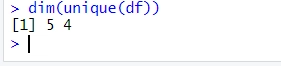
We can see that the unique() function returns a data frame with only the unique rows from df, in the same order as they appear in df. The dimensions of the output data frame are 5 rows and 4 columns, which is the number of unique rows in df. We can also use the dim() function to check this:
Subsetting using unique() and subset()
The unique() function on dataframes compares the values in each column and returns only the rows with distinct values in all columns. If we want to compare the values in a specific column or a subset of columns, we can use the subset() function to select the columns we want to compare. For example, suppose we want to get the unique rows based only on the name column. We can use the subset() function to select the name column and then apply the unique() function:
unique(subset(df, select = name))Code language: R (r)We can see that the unique() function returns a data frame with only the unique values in the name column, in the same order as they appear in df. The dimensions of the output data frame are 5 rows and 1 column, which is the number of unique values in the name column. We can also use the dim() function to check this.
Moreover, we can use the subset() function to select more than one column to compare. For example, suppose we want to get the unique rows based on the name and gender columns. We can use the subset() function to select the name and gender columns and then apply the unique() function.
unique(subset(df, select = c(name, gender)))Code language: R (r)We can see that the unique() function returns a dataframe with only the unique values in the name and gender columns, in the same order as they appear in df. The dimensions of the output dataframe are 5 rows and 2 columns, which is the number of unique values in the name and gender columns. Again, we can use the dim() function to check this.
How to count the number of unique values in a data set using unique()
Another useful application of the unique() function in R is to count the number of unique values in a data set. This can be done by applying the length() function to the output of the unique() function, which returns the number of elements in a vector, matrix, or data frame. For example, suppose we have a dataframe called df (the same as above).
# Count the number of unique names
length(unique(df$name))
# Output: 5
# Count the number of unique ages
length(unique(df$age))
# Output: 5
# Count the number of unique genders
length(unique(df$gender))
# Output: 2Code language: PHP (php)
As you can see, the unique() function combined with the length() function can give us a quick overview of the diversity of our data set, and help us identify any potential errors or outliers. For example, if we expected to have more than two genders in our data set, we might want to check if there was any missing or incorrect data in the gender column. For more posts about counting:
Summary
In this post, we have learned how to use the unique() function in R in five different ways, with examples and code snippets for each case. We have learned how the unique() function can return a vector, matrix, or dataframe with only the unique values from the original data, and how it can count the number of unique values in a data set. The unique() function in R is a useful tool for data analysis and visualization, as it can help you identify and remove duplicate values, or find out the diversity or similarity of your data. I hope you have enjoyed this post and learned something new and useful. If you did, please share it with your friends and colleagues on social media, and leave your feedback and questions in the comments section below. I would love to hear from you and answer issues you may have.
Resources
Here are some more R tutorials you may find helpful:
- R: Remove Rows with Certain Values using dplyr
- Convert Multiple Columns to Numeric in R with dplyr
- How to Sum Rows in R: Master Summing Specific Rows with dplyr
- Sum Across Columns in R – with dplyr & base Functions