This Pandas tutorial will teach us how to work with Pandas dataframes. We will learn how to read and write Excel (i.e., xlsx) and CSV files using Pandas. Moreover, we will also learn how to add a column to Pandas dataframe object, and how to remove a column. Finally, we will learn how to subset and group our dataframe.
If you are unfamiliar with installing Python packages I have recorded a YouTube video explaining how to install Pandas. There is also a playlist with videos towards the end of the post, which includes videos of all topics covered in this post.
Table of Contents
- What is Pandas Dataframe?
- How to Install Pandas in Python
- Which Pandas Version
- Pandas Create Dataframe
- Loading Data Using Pandas
- Working with Pandas Dataframe
- How to Group Data using Pandas Dataframe
- Pandas Tutorial Playlist – Part 1
- Summary of What We Have Learned
What is Pandas Dataframe?
Pandas is a library that enables data analysis in Python. It’s very easy to use and quite similar to the programming language R’s data frames. It’s open-source and free.
When working datasets from real experiments we need a method to group data of differing types. For instance, in psychology research, we often use different data types. If you have experience in data analysis with SPSS, you are probably familiar with some of them (e.g., categorical, ordinal, continuous).
Imagine that we have collected data in an experiment in which we were interested in how images of kittens and puppies affected the mood of the subjects and compared it to neutral images. After each image was randomly presented on a computer screen, the subjects were asked to rate their mood on a scale.
Then the data might look like this:
| Condition | Mood Rating | Subject Number | Trial Number |
| Puppy | 7 | 1 | 1 |
| Kitten | 6 | 1 | 2 |
| Puppy | 7 | 1 | 4 |
| Neutral | 6 | 1 | 5 |
| … | … | … | … |
| Puppy | 6 | 12 | 9 |
| Neutral | 6 | 12 | 10 |
This is generally what a dataframe is. Working with Pandas dataframe will make working with our data more manageable. See here for more extensive information.
How to Install Pandas in Python
In this section, we will cover some methods for installing Pandas. As mentioned, one way is to install the Python distribution Anaconda (see this YouTube video, for instance). If running a Python environment or using miniconda, we can use conda package manager or pip to install pandas.
Installing Pandas using conda
- Start the Anaconda Prompt
- Type conda install -c anaconda pandas and hit enter
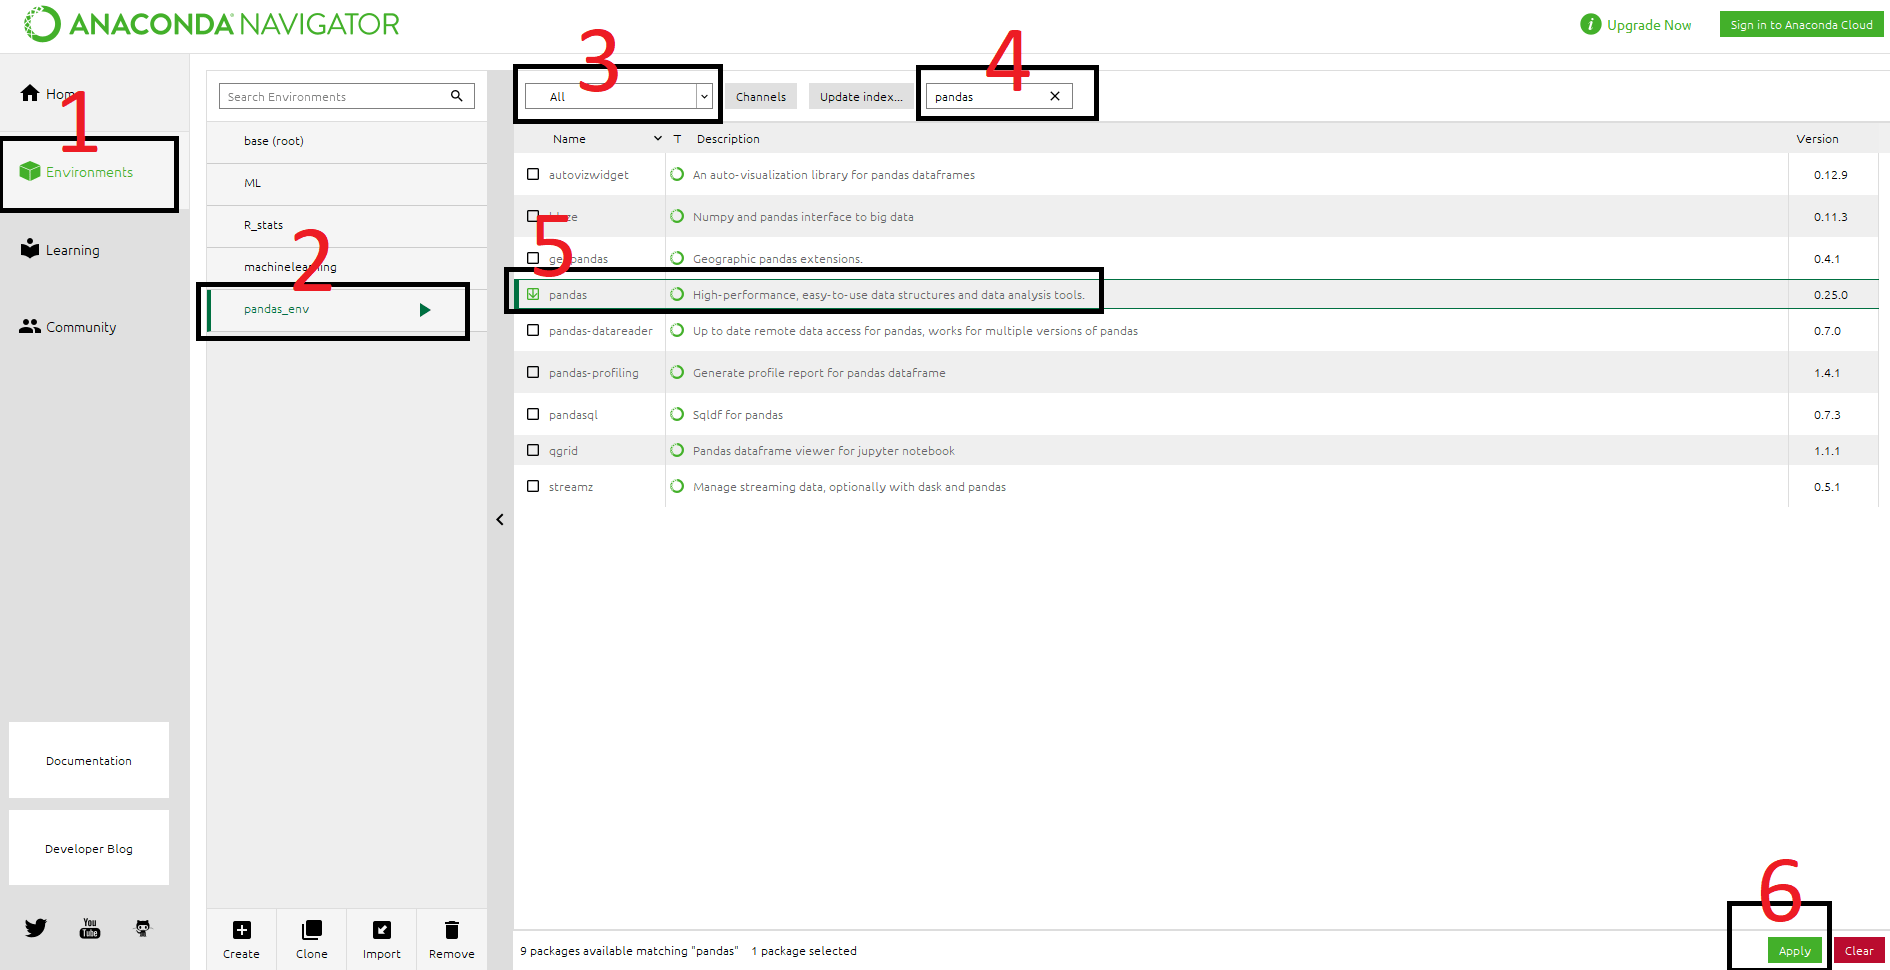
We can also use the Anaconda Navigator. First, select Environments, and click on the environment in which we want to install Pandas. When we have selected our environment we select “all” in the drop-down menu (next to button “channels”, see image below). Now, we can search for “pandas” and select it. Finally, we hit the apply button in the bottom right corner of the Anaconda Navigator.
How to use Pip to Install Pandas
Before we continue this Pandas Dataframe tutorial with how to create a Pandas dataframe, we are going to learn how to install pandas using pip. It’s pretty simple;
- Open up a command prompt and,
- Type pip install pandas and hit enter
Note: install the Python packages in a virtual environment. In a recent post, there is a discussion on how to install (including in virtual environment), use, and update Python packages
Which Pandas Version
Now that we have installed Pandas, we can find out which version we have in two ways. If we are using Jupyter Notebooks, we can open a new notebook and type the following lines in a code cell:
import pandas as pd
print(pd.__version__)Code language: Python (python)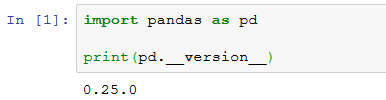
We can also find out which version we have of Pandas using conda. That is, if we installed Pandas using conda we can type the following in Anaconda Prompt:
conda list pandasCode language: Bash (bash)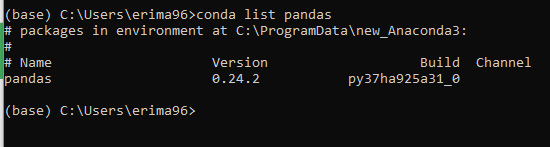
Note that the difference between versions is due to the Jupyter Notebook is run within a Python virtual environment with a newer version of Pandas than in the base Anaconda environment. Now, we may wonder how to upgrade Pandas? If we need to update Pandas, we can use both pip and conda.
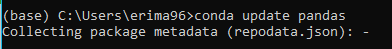
How to Upgrade Pandas
Now we will answer the question “how do I upgrade Pandas on Anaconda?”. It’s pretty simple: open up the Anaconda Prompt and type conda update pandas.
- The post on how to upgrade pip will go into detail about upgrading pip, and if you use the “==” sign, you can use pip to install a specific version of Pandas.
Pandas Create Dataframe
Now we can continue this Pandas dataframe tutorial by learning how to create a dataframe. In Psychology, the most common methods to collect data is using questionnaires, experiment software (e.g., PsychoPy, OpenSesame), and observations.
When using digital applications for both questionnaires and experiment software, we will, of course, also get our data in a digital file format (e.g., Excel spreadsheets and Comma-separated CSV files).
If the dataset is relatively small, it is possible to create a dataframe directly using Python and Pandas:
import pandas as pd
# Create some variables
trials = [1, 2, 3, 4, 5, 6]
subj_id = [1]*6
group = ['Control']*6
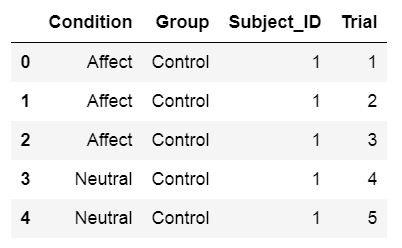
condition = ['Affect']*3 + ['Neutral']*3
# Create a dictionairy
data = {'Condition':condition, 'Subject_ID':subj_id,
'Trial':trials, 'Group':group}
# Create the dataframe
df = pd.DataFrame(data)
df.head()Code language: Python (python)In the example above, you’ve learned how to create a Pandas dataframe from a dictionary. However, crunching in data by hand when the datasets are large is very time-consuming and nothing to recommend. Below, you will learn how to read Excel Spreadsheets and CSV files in Python and Pandas.
Here’s a YouTube video also covering how to create an empty Pandas dataframe and how to create a frame from a NumPy ndarray:
Loading Data Using Pandas
As mentioned above, large dataframes are usually read into a dataframe from a file. Here, we will learn how to use Pandas read_excel and read_csv methods to load data into a dataframe. There are a lot of datasets available to practice when working with the Pandas dataframe. In the examples below, we will use some of the R datasets found here.
- Learn how to read SPSS files using Python and Pandas
Working with Excel Spreadsheets Using Pandas
In this section of this Pandas dataframe tutorial, we will learn how to work with Excel spreadsheets. Spreadsheets can quickly be loaded into a Pandas dataframe, and you can, of course, also write a spreadsheet from a dataframe.
Reading Excel Files Using Pandas read_excel
One way to read a dataset into Python is using the method read_excel, which has many arguments.
pd.read_excel(io, sheet_name=0, header=0)Code language: Python (python)iois the Excel file containing the data. It should be type string data type and could be a locally stored file as well as a URL pointing to an Excel file.sheet_namecan be a string for the specific sheet we want to load and integers for zero-indexed sheet positions. If we specifyNoneall sheets are read into the dataframe.headercan be an integer or a list of integers. The default is 0 and the integer represents the row where the column names. AddNoneif you don’t have column names in your Excel file.
See the read_excel documentation if you want to learn about the other arguments.
Pandas Read Excel Example
Here is a working example on how to use Pandas read_excel:
import pandas as pd
# Load a XLSX file from a URL
xlsx_source = 'http://ww2.amstat.org/publications' \
'/jse/v20n3/delzell/conflictdata.xlsx'
# Reading the excel file to a dataframe.
# Note, there's only one sheet in the example file
df = pd.read_excel(xlsx_source, sheet_name='conflictdata')
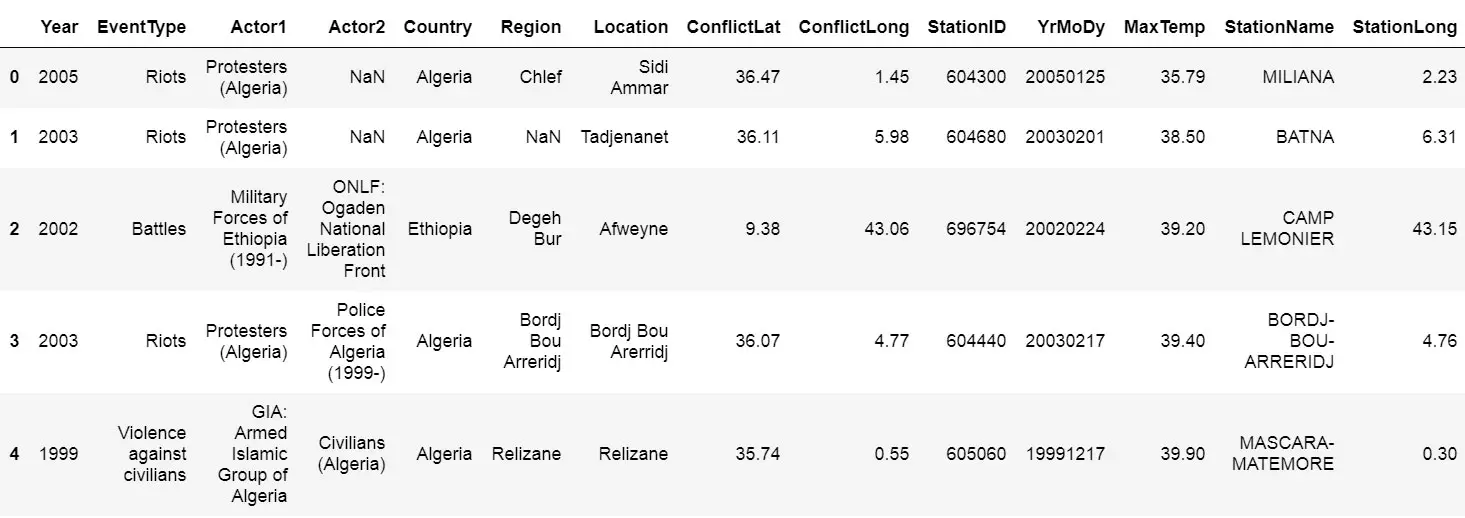
df.head()Code language: Python (python)In the example above, we are reading an Excel file (‘conflictdata.xlsx’). The dataset only has one sheet but for clarity, we added the ‘conflictdata’ sheet name as an argument. That is, sheet_name was, in this case, nothing we needed to use.
The last line may be familiar to R users and is printing the first X lines of the dataframe:
As you may have noticed we did not use the header argument when we read the Excel file above. If we set header to None we will get digits as column names. This, unfortunately, makes working with the Pandas dataframe a bit annoying.
Luckily, we can pass a list of column names as an argument. Finally, as the example, xlsx file contains column names we skip the first row using skiprows. Note, skiprows can be used to skip more than one row. Just add a list with the row numbers that are to be skipped.
Here is another example of how to read an Excel file using Python Pandas:
import pandas as pd
xlsx_source = 'http://ww2.amstat.org/publications' \
'/jse/v20n3/delzell/conflictdata.xlsx'
# Creating a list of column names
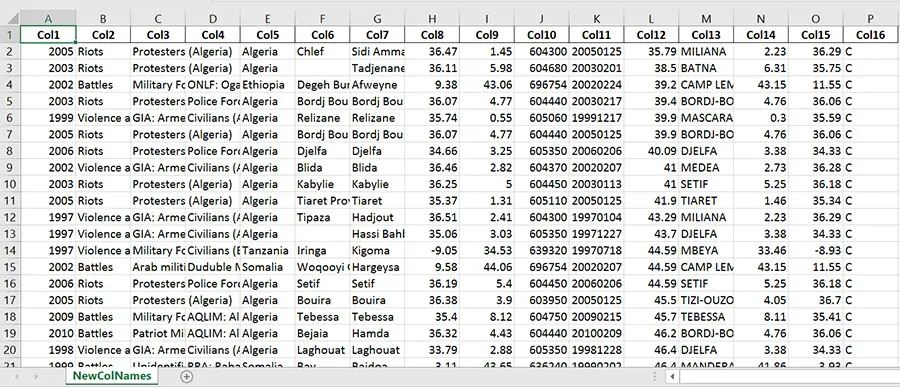
col_names = ['Col' + str(i) for i in range (1, 17)]
# Reading the excel file
df = pd.read_excel(xlsx_source, sheet_name='conflictdata',
header=None, names=col_names, skiprows=[0])
df.head()Code language: Python (python)Now, there are of course a bunch of arguments that you can use. For example, the index_col argument can be used if you want to make a column index in the Pandas dataframe. That is when reading your excel file. In the next part of this tutorial, you will learn how to write Excel files, as well.
Writing Excel Files Using Pandas to_excel
In this section, of the Pandas dataframe tutorial, we are going to learn how to write to an Excel file. That is, we can save a new xlsx (or overwrite the old, if we like) using Pandas to_excel method.
For instance, say we made some changes to the data (e.g., aggregated data, changed the names of factors or columns) and we collaborate with other researchers. Now we do not want to send them the old Excel file.
df.to_excel(excel_writer, sheet_name='Sheet1', index=False)Code language: Python (python)excel_writercan be a string (your file name) or an ExcelWriter object.sheet_nameshould be a string with the sheet name. Default is ‘Sheet1‘.indexshould be a boolean (i.e.,TrueorFalse). Typically, we don’t want to write a new column with numbers. Default isTrue.
Pandas dataframe to Excel example:
df.to_excel('newfilename.xlsx', sheet_name='NewColNames', index=False)Code language: Python (python)It was pretty simple now have written a new Excel file (xlsx) to the same directory as your Python script.
- Also, check my YouTube video on how to read and write Excel files using Pandas
- Check my newest post Pandas Excel Tutorial: How to Read and Write Excel Files for a more in-depth guide on how to use read_excel
Working with CSV Files Using Pandas
Now we continue this Pandas dataframe tutorial to a more common way to store data, at least in Psychology research; CSV files. We will learn how to use Python Pandas to load CSV files into dataframes.
pd.read_csv(filepath_or_buffer, sep=',')Code language: JavaScript (javascript)file_path_buffer is the name of the file to be read from. The file_path_buffer can be relative to the directory that your Python script is in or absolute. It can also be a URL. What is important here that what we type in first is a string. Don’t worry we will go through this later with an example.
sep is the delimiter to use. The most common delimiter of a CSV file is a comma (“,”) and it’s what delimits the columns in the CSV file. If you don’t know you may try to set it to None as the Python parsing engine will detect the delimiter.
Have a look at the documentation if you want to learn about the other arguments.
Reading a CSV File with Pandas:
It is easy to read a csv file in Python Pandas. Here is a working example on how to use Pandas read_csv:
import pandas as pd

df = pd.read_csv('https://vincentarelbundock.github.io/' \
                 'Rdatasets/csv/psych/Tucker.csv', sep=',')
df.head()Code language: Python (python)
There are of course occasions when you may want to save your dataframe to csv. This is, of course, also possible with Pandas. We just use the Pandas dataframe to_csv method:
df.to_csv(path_or_buf, sep=',', index=False)Code language: PHP (php)Pandas Dataframe to CSV Example:
Here is how to save the dataframe to a .csv file:
df.to_csv('newfilename.csv', sep=';', index=False)Code language: PHP (php)It was simple to export Pandas dataframe to a CSV file, right? Note that we used a semicolon as a separator. In some countries (e.g., Sweden), a comma is used as a decimal separator. Thus, this file can now be opened using Excel if we want to.
Here is a video tutorial for reading and writing CSV files using Pandas:
We have learned how to read and write Excel and CSV files using Pandas read_excel, to_excel, and read_csv, to_csv methods. The next section of this Pandas tutorial will continue with nstructions on how to work with Pandas dataframe.
- Pandas Read CSV Tutorial
- Data can also be read from HTML tables using Pandas read_html.
Working with Pandas Dataframe
Now that we know how to read and write Excel and CSV files using Python and Pandas, we continue working with Pandas Dataframes. We start with the basics: head and tail.
Pandas head Method
head enables us to print the first x rows. As explained earlier, by default, we see the first five rows. We can, of course, have a look at more or fewer rows:
import pandas as pd

df = pd.read_csv('https://vincentarelbundock.github.io/' \
'Rdatasets/csv/carData/Wong.csv', sep=',')
df.head(4)Code language: Python (python)
Pandas tail Method
Using tail, on the other hand, will print the x last rows of the dataframe:
df.tail(4)Code language: Python (python)Each column or variable in a Pandas dataframe has a unique name. We can extract variables using the dataframe name and the column name. This can be done using the dot sign:
piq = df.piq
piq[0:4]Code language: Python (python)
We can also use the [ ] notation to extract columns. For example, df.piq and df['piq'] is equal:
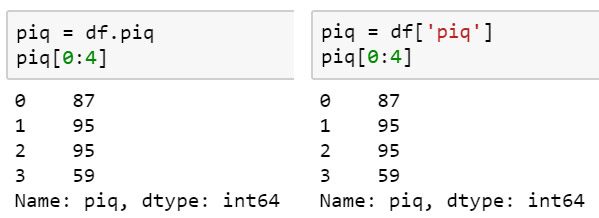
Furthermore, if we pass a list, we can select more than one of the variables in a dataframe. For example, we get the two columns “piq” and “viq” (['piq', 'viq'] ) as a dataframe like this:
pviq = df[['piq', 'viq']]Code language: Python (python)It is, of course, also possible to use Pandas to convert a column to datetime, if needed.
How to Get Column Names in Pandas Dataframe
In this section of the Pandas dataframe tutorial, we will learn how to get column names from a Pandas dataframe.
df.keys()Code language: Python (python)
If you need more information about how to get the column names, see the post about 5 other methods to get the column names from Pandas dataframe.
How to Add Column to Dataframe Pandas
We can also create a new variable within a Pandas dataframe, by naming it and assigning it a value. For instance, in the dataset we are working on here, we have two variables: “piq” (mathematical IQ) and “viq” (verbal IQ). We may want to calculate a mean IQ score by adding “piq” and “viq” together and then dividing it by 2.
Pandas Add Column Example:
We can calculate this and add it to a new column in the dataframe relatively easy:
df['iq'] = (df['piq'] + df['viq'])/2Code language: JavaScript (javascript)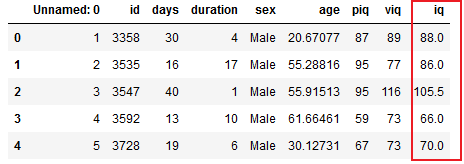
Alternatively, we can calculate this using the method mean(). Here, we use the argument axis = 1 so that we get the row means:
df['iq'] = df[['piq', 'viq']].mean(axis=1)Code language: Python (python)Sometimes we may want to add an empty column to a dataframe without doing any calculations. it is done similarly:
df['NewCol'] = ''Code language: Python (python)Remove Columns From a Dataframe
Other times, we may also want to drop columns from a Pandas dataframe. For instance, the column in our df named ‘Unnamed: 0’ is unnecessary.
Removing columns can be done using drop. In this example, we will add a list to drop the ‘NewCol’ and the ‘Unnamed: 0’ columns. If we only want to remove one column from the Pandas dataframe, we would input a string (e.g., ‘NewCol’).
df.drop(['NewCol', 'Unnamed: 0'], axis=1, inplace=True)Code language: Python (python)Note, to drop columns, not rows, the axis argument is set to 1, and to make the changes to the dataframe, we set inplace to True.
Column removal and dropping can also be done using the Pyjanitor package. See the new post “The Easiest Data Cleaning Method using Python & Pandas” to learn more. The above calculations are great examples of when you may want to save your dataframe as a CSV file.
- If you need to reverse the order of your dataframe check my post Six Ways to Reverse Pandas Dataframe
After we have imported our data, we might also need to change the variable names. This is described in the more recent post about renaming columns in in Pandas dataframe.
How to Subset Pandas Dataframe
There are many methods for selecting rows of a dataframe. A straightforward method is by using query. This method is similar to the function subset in R.
Here is an example in which we subset the dataframe where “piq” is greater than 80:
df_piq = df.query('piq > 80')
df_piq.head(4)Code language: Python (python)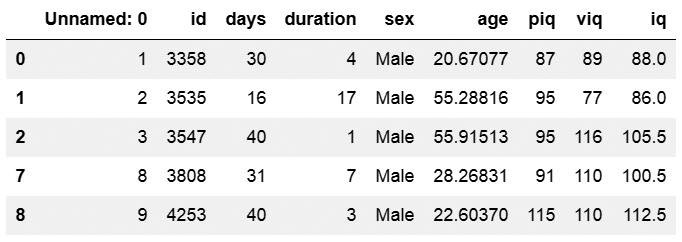
df_males = df[df['sex'] == 'Male']Code language: JavaScript (javascript)The following subsetting example shows how to filter the dataframe with multiple criteria. In this case, we select observations from df where sex is male and iq is greater than 80. The ampersand “&” in Pandas is the preferred AND operator.
df_male80 = df.query('iq > 80 & sex == "Male"')Code language: Python (python)It is also possible to use the OR operator. In the following example, we filter Pandas dataframe based on rows with a value of age greater than or equal to 40 or less than 14. Furthermore, we filter the dataframe by the columns ‘piq’ and ‘viq’.
df.query('age >= 40 | age < 14')[['piq', 'viq']].head()Code language: Python (python)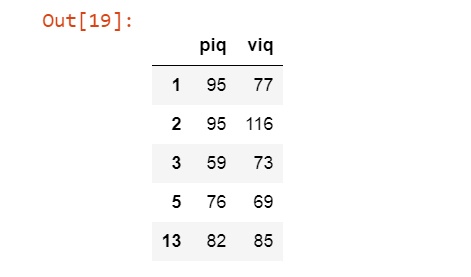
Random Sampling Rows From a Dataframe
Using the sample method, it’s also possible to draw random samples of size n from the. In the example below, we draw 25 random samples (n=25) and get a subset of ten observations from the Pandas dataframe.
df_random = df.sample(n=25)Code language: Python (python)How to Group Data using Pandas Dataframe
Now, we have learned how to read Excel and CSV files to a Panda dataframe, add and remove columns, and subset the created dataframe. Although subsets may come in handy, there is no need to do this when looking at specific groups in the data.
Pandas have a method for grouping the data, which can come in handy; groupby. Especially if you want to summarize your data using Pandas.
As an example, based on theory, we may have a hypothesis that there’s a difference between men and women. Thus, in the first example, we will group the data by sex and get the mean age, piq, and viq.
df_sex = df.groupby('sex')
df_sex[['age', 'piq', 'viq']].mean()Code language: Python (python)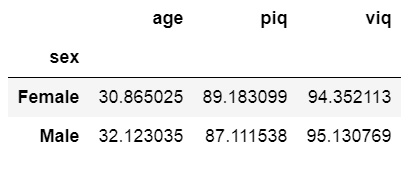
More about Pandas Groupby:
If we were to test our hypothesis fully we would need to apply hypothesis testing. Here are two posts about carrying out between-subject analysis of variance using Python:
In the following example, we will use Pandas describe on our grouped dataframe. Using describe we will get a table with descriptive statistics (e.g., count, mean, standard deviation) of the added column ‘iq’.
df_sex[['iq']].describe()Code language: Python (python)More about summary statistics using Python and Pandas can be read in the post Descriptive Statistics using Python. If you are interested in learning more, you can read the book Python for Data Analysis (see my review).
Pandas Tutorial Playlist – Part 1
Before summing up this Pandas tutorial, here’s a playlist covering the topics above. Note the first video covers how to install Pandas.
Summary of What We Have Learned
- Working with CSV and Excel files using Pandas
- Pandas read_excel & to_excel
- Working with Pandas Dataframe
- Add a column to a dataframe
- Remove a column from a dataframe
- Subsetting a dataframe
- Grouping a dataframe
There are, of course, many more things that we can do with Pandas data frames. We usually want to explore our data with more descriptive statistics and visualizations. Make sure to check back here for more basic guides and in-depth guides on working with Pandas dataframe. These guides will include how to visualize data and how to carry out parametric statistics.
Comment below if you have any requests or suggestions on what should be covered next!

Thank you very much Erik,
posts from generous people like you really help to fast track others, including me. With many years of data specialisation in SQL and Dot Net behind me, it’s great to be developing Python skills and I appreciate your help along this journey. I like your approach.
Regards from Sydney, Australia – David
Thanks David,
I am glad that you found this useful! I try to cover somethings that I miss, myself, when learning how to do them.
interesting ! Thanks for information !
As a data professional moving on from the world of SSIS and SQL, your post proved to be a goldmine of great information. I know this might be a noob request. Can you write another blog which uses sql like syntax to make data modification in python data fromes?
Hey,
Glad you liked the post! I will have a look at what you are suggesting.
Erik