This tutorial will cover how to calculate absolute value in R. it will cover how to compute absolute values using the built-in function abs(), e.g., abs(YourVector). The following section will give you a detailed outline of what this R tutorial covers.
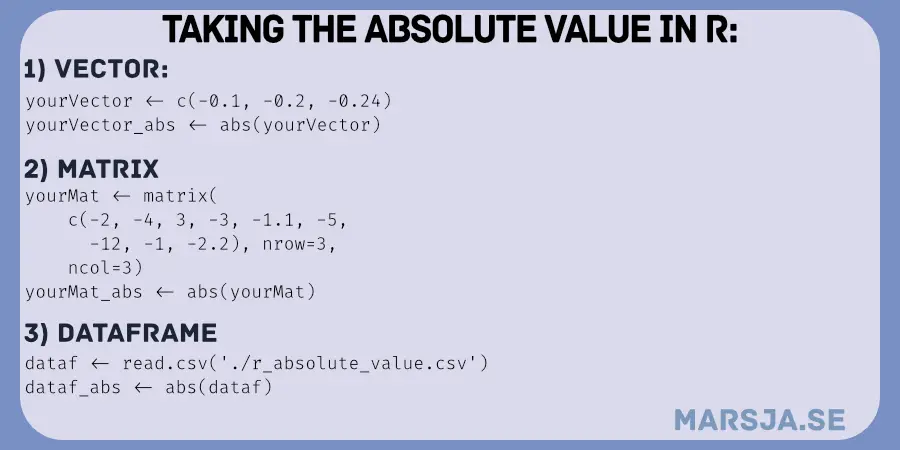
Table of Contents
- Outline
- Required Software/Packages
- Absolute Value in R: Example 1 from a Vector
- Absolute Value in R: Example 2 from a Matrix
- How to Take Absolute Value in R: X Examples with Dataframes
- Conclusion
- R Resources
Outline
The structure of the post is as follows. First, we will get the answer to a couple of simple questions. Note most of them might be enough for you to understand how to get the absolute value using the R statistical programming environment. After this, you will learn what you need to know and have installed what yhou need in your R environment to follow this post. Third, we will start by taking a more detailed example of how to take the absolute value of a vector in R. This section is followed by how to use the abs() function, again, on a matrix containing negative values. Finally, we will also look at how to take the absolute values in a dataframe in R. This section will also use some of the functions of the dplyr (Tidyverse) package.
The absolute value in R is the non-negative value of x. To be clear, the absolute value in R is no different from that in any other programming language, as this has something to do with mathematics rather than a programming language. In the following FAQ, you will learn how to use the abs() function to get absolute values of an e.g. vector.
We can use the abs() function to change the negative numbers to positive in R. For example, if we have the vector x containing negative numbers, we can change them to positive numbers by typing abs(x) in R.
Now that we have some basic understanding of how to change negative numbers to positive ones by taking their absolute values, we can look at what we need to follow in this tutorial. That is, in the next section, you will learn about the requirements of this post.
Required Software/Packages
First, if you already have R installed, you will also have the function abs() installed. However, if you want to use some functionality of the dplyr package (as in the later examples) you will also need to install dplyr (or Tidyverse). Moreover, if you want to read an .xlsx file in R with the readxl package, you need to install it, as well. Here it might be worth pointing out that dplyr contains a lot of great functions. For example, you can use dplyr to remove columns in R as well as to select columns by e.g. name or index.

To install dplyr you can use the install.packages() function. For example, to install the packages dplyr and readxl you type install.packages(c("dplyr", "readxl")). Note, you can change “dplyr” and “readxl” to “tidyverse” if you want to install all these packages as they are both part of the Tidyverse packages. In the next section, you will get the first example of how to take absolute value in R using the abs() function.
Absolute Value in R: Example 1 from a Vector
Here is how to take the absolute value from a vector in R:
# Creating a vector with negative values
negVec <- seq(-0.1, -1.1, by=-.1)

# R absolute value from vector
abs(negVec)Code language: R (r)
In the code chunk above, we first created a sequence of numbers in R with the seq() method. As you may understand, all the numbers we generated were negative. In the second line, therefore, we used the abs() function to take the absolute value of the vector. Here’s the output in which all the negative numbers are now positive:

In the next example, we will create a matrix filled with negative numbers and get the absolute values from the matrix.
Absolute Value in R: Example 2 from a Matrix
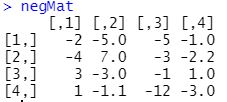
If we, on the other hand, have a matrix, here is how to take the absolute value in R:
negMat <- matrix(
  c(-2, -4, 3, 1, -5, 7,
    -3, -1.1, -5, -3, -1,
    -12, -1, -2.2, 1, -3.0),
  nrow=4,
  ncol=4)

# Take absolute value in R
abs(negMat)Code language: R (r)
In the example above, we created a small matrix using the matrix() function and then used the abs() function to convert all negative numbers in this matrix to positive (i.e., take the absolute values of the matrix). This example will be followed by a couple of examples in which we will take the absolute values in data frames.

Now that you have changed the negative numbers to positive, you may want to quickly get Tukey’s five number summary statistics using the R function fivenum()
How to Take Absolute Value in R: X Examples with Dataframes
In this section, we will learn how to get the absolute value in dataframes in R. First, we will select one column and change it to absolute values. Second, we will select multiple columns and, again, use the abs() function on these. Note that here we will use the mutate() function from dplyr. In the last example, we will also use the select_if() function. This dplyr function is great if we want to use abs() function on, e.g., all numerical columns in a dataframe.
First, however, we are going to import the example dataset “r_absolute_value.xlsx” using the readxl package and read_excel() function:
library(readxl)

dataf <- read_excel('./SimData/r_absolute_value.xlsx')
head(dataf)Code language: JavaScript (javascript)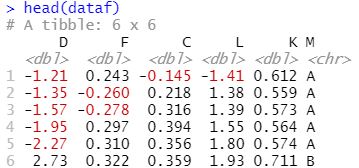
We are not getting into detail regarding reading .xlsx files in R. However, you can download the example dataset in the link above. You can copy-paste the code chunk above if you store this .xlsx file in a subfolder to your r-script (see code above). However, if you store it somewhere else on your computer you should change the path to the file’s location. In the next example, we will get the absolute value from a single column in the dataframe.
Absolute Value from a Column in a Dataframe
Here is how to take the absolute value from one column in R and create a new column:
dataf$D.abs <- abs(dataf$D)

head(dataf)Code language: R (r)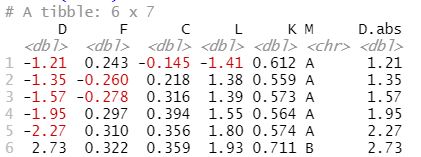
Note that in the example above, we selected a column using the $-operator, and then we used the abs() function to take the absolute value of this column. In turn, the absolute values of this column were also added to a new column which we created, again, using the $-operator. It is, of course, also possible to use dplyr and the mutate() function instead. Here’s another method, that we used to add a new column to a R dataframe as well as to add a column based on values in other columns in R. Here’s how to:
dataf <- dataf %>%
  mutate(D.abs <- abs(D))Code language: R (r)
Now, learning the above method is quite neat because it is a bit simpler to work with mutate() compared to using only the $-operator. For example, we can make use of the %>%-operator as well (as in the example above). Furthermore, creating more than one new column will make the code look cleaner (as in the following example). In the next example, we will create two new columns by taking the absolute values of two others.
Absolute Value from Multiple Columns in R’s dataframe
Here is how we would take two columns and get the absolute value from them:
library(dplyr)

dataf <- dataf %>%
  mutate(F.abs = abs(F),
         C.abs = abs(C))Code language: HTML, XML (xml)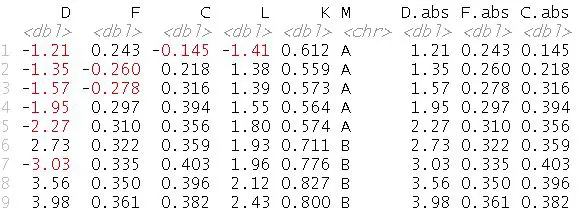
Again, we worked with the mutate() function and created two new variables. Here it might be worth mentioning that if we only want to get the absolute values from the numerical columns in our dataframe without creating new variables, we can, instead, use the select() function to select the specific columns. Here’s an example in which we select two columns and take their absolute value:
dataf <- dataf %>%
  select(c(F, C)) %>%
  abs()Code language: R (r)
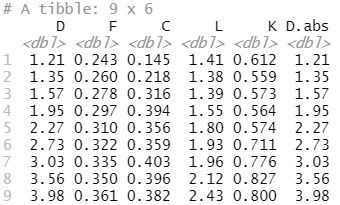
In the next section, we will use this newly learned method to take the absolute value in all the numerical columns in the dataframe. However, in this example, we will use the select_if() function and only select the numerical columns. This is good to know because if we tried to run abs() on the complete dataframe we would get an error. Specifically, this would return the error “Error in Math.data.frame(dataf) : non-numeric variable(s) in data frame: M”.

In the next section, we will work with the select_if() function as well as the %>% operator, again. Another awesome operator in R is the %in% operator. Make sure you check this post out to learn more:
Absolut Value from all Numerical Columns in Dataframe in R
Here is how to apply the abs() function on all the numerical columns in the dataframe:
dataf.abs <- dataf %>%
  select_if(is.numeric) %>%
  abs()Code language: R (r)
Note how we, again, used the %>%-operator (from magittr but imported with dplyr) to apply the select_if() on the dataframe. Again, we used the %>%-operator and applied the abs() function to all the numerical columns. Notice how the new dataframe only contains numerical columns (and absolute values).
Now, before concluding this post, it may be worth that, again, pointing out that the tidyverse package is a very handy package. That is, it comes with various packages that can be used for manipulating and cleaning your data. For example, you can use dplyr to rename factor levels in R , the lubridate package to extract year from date in R, and ggplot2 to create a scatter plot.
Conclusion
In this tutorial, you have laerned getting the absolute value in R for vectors, matrices, and dataframe columns. We have used the abs() function has to convert negative values into positive ones. Understanding how to manipulate data is important for various data-driven tasks.
Knowing how to take the absolute value in R is good for, e.g., data cleaning, preprocessing, and preparing data for statistical analysis. It ensures that your data remains consistent and accurate, enabling you to draw insights and make informed decisions based on your data.
Learning is a journey, and I encourage you to experiment and explore further. If you have any questions, suggestions, or corrections regarding this tutorial, please do not hesitate to leave a comment below. Sharing your thoughts can spark discussions and collaborations, enriching the learning experience for everyone. Your feedback is appreciated, as it helps me improve and tailor future content to meet your needs.
R Resources
Here are a couple of good tutorials that you may find helpful:
- Correlation in R: Coefficients, Visualizations, & Matrix Analysis
- How to Rename Column (or Columns) in R with dplyr
- Binning in R: Create Bins of Continuous Variables
- Coefficient of Variation in R
- How to Calculate Z Score in R
- How to Standardize Data in R
- Test for Normality in R: Three Different Methods & Interpretation

Great post! I’ve been struggling with handling absolute values in different data structures in R, and your explanations and examples made it so much clearer. Thanks for breaking it down for vectors, matrices, and dataframes—super helpful!
Thank you. Glad you found it helpful.