In this volcano plot in R tutorial, we will use ggplot2, a popular package for creating beautiful and customizable graphics in R. A volcano plot in R is a scatter plot showing the relationship between the fold change and the statistical significance in certain data types.
Table of Contents
Outline
In this data visualization tutorial, we will start by learning the prerequisites to follow the post. To create a volcano plot in R you follow these general steps that we will learn in this post;:
- Prepare your data
- Plot the data using ggplot2
Prerequisites
Before we start making a volcano plot in R, we need to have some basic knowledge of R and ggplot2. R is a free and open-source programming language for statistical computing and graphics. ggplot2 is a package that implements the grammar of graphics, a system for creating plots based on layers and aesthetics. If you are new to R or ggplot2, you can check out some of the online resources below:
- The official website of R
- The tidyverse website, which includes ggplot2 and other useful packages
- R for Data Science, a book by Hadley Wickham and Garrett Grolemund
- The ggplot2 documentation and reference
To install R, you can download it from the official website and follow the instructions for your operating system. To install ggplot2, we can run the following code in R:
install.packages("ggplot2")Code language: R (r)It is also recommended to have the latest version of R installed. To update R, we can use the installr package, which provides a function to update R from within R. To install installr, we can run the following code in R:
install.packages("installr")Code language: R (r)Next, we use the updateR function to get the latest version. Finally, in this volcano plot tutorial, we will use sample data from the airway package and functions from the DSeq2 package. To follow along the code example below we need to install it using the BiocManager package:
install.packages("BiocManager")
BiocManager::install("airway")Code language: PHP (php)
In the code snippet above, we will get both the airway package and the DSeq2 package installed.
Preparing Data
Before plotting the data, we need to prepare the data (this step is optional if your data is already ready to visualize). First, we load the package DSeq2 and the airway data:
library(DESeq2)
data("airway", package = "airway")Code language: R (r)
The airway data set contains the gene expression counts for four cell lines treated with dexamethasone, a drug that reduces inflammation. We can use the DESeq2 package to perform the differential expression analysis and obtain each gene’s fold change and p-value. To do this, we can run the following code in R:
dds <- DESeqDataSet(airway, design = ~ cell + dex)
dds <- DESeq(dds)
res <- results(dds, contrast = c("dex", "untrt", "trt"))Code language: R (r)
In the code chunk above, we first create a DESeqDataSet object from the airway data set, specifying the design formula that includes the cell line and the treatment as factors. Finally, we use the results function to extract the results table, which contains the log2 fold change, the standard error, the Wald statistic, the p-value, and the adjusted p-value for each gene.
To make a volcano plot in R, we need to transform the p-value into a negative log10 scale, which is also known as the significance level. To do this, we can run the following code in R:
res$sig <- -log10(res$pvalue)Code language: R (r)How to Make a Volcano Plot in R
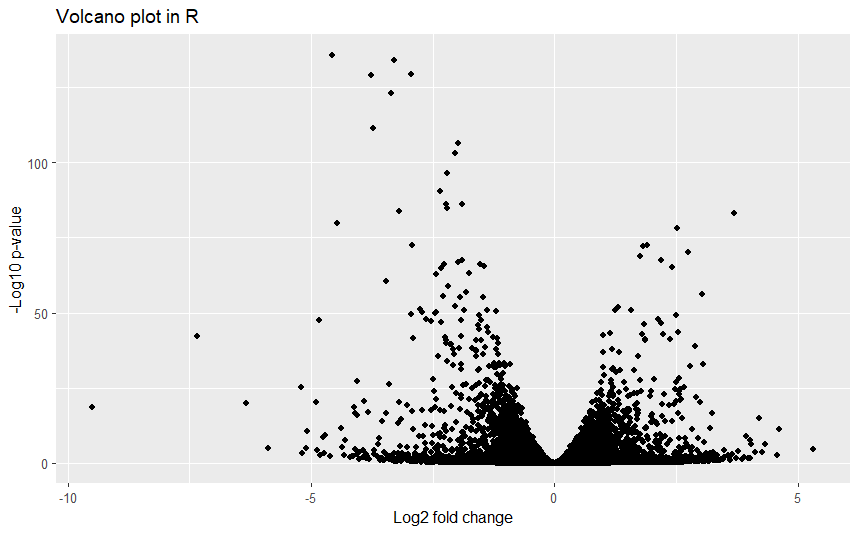
To make a volcano plot in R using ggplot2, we can use the following code:
library(ggplot2)
ggplot(res, aes(x = log2FoldChange, y = sig)) +
  geom_point() +
  xlab("Log2 fold change") +
  ylab("-Log10 p-value") +
  ggtitle("Volcano plot in R")Code language: R (r)
In the code snippet above, we first load the ggplot2 package and then use the ggplot function to create a ggplot object from the results table, mapping the log2 fold change to the x-axis and the significance level to the y-axis. Then, we add a geom_point layer to draw the points for each gene. Finally, we add some labels and a title to the plot using the xlab, ylab, and ggtitle functions. The output should look something like this:
Conclusion
In this volcano plot in R tutorial, we have learned how to make a volcano plot in R using ggplot2, a powerful and versatile package for creating graphics in R. I hope that this tutorial has helped you to understand how to make a volcano plot in R and how to customize it to your needs. If you have any questions or feedback, please feel free to leave a comment below. And if you found this tutorial helpful, please share it with your friends and colleagues on social media.
More tutorials
Here are more data visualization tutorials you may find useful:
- How to Make a Residual Plot in R & Interpret Them using ggplot2
- Plot Prediction Interval in R using ggplot2
- How to Make a Scatter Plot in R with Ggplot2
- How to Create a Violin plot in R with ggplot2 and Customize it