In a previous post, we learned how to select columns in data.table. Now, we will focus on how to filter in data.table in R, which allows us to extract relevant data based on conditions. data.table is known for its speed, making filtering much faster than alternatives like dplyr or base R. At least when working with large data sets.
Table of Contents
- Basic Filtering in data.table
- How to Filter data.table in R with Multiple Conditions
- Filter data.table with %in%
- Filter data.table by Group
- Conclusion
- Resources
Basic Filtering in data.table
Filter rows in data.table is easy. We use the i argument inside square brackets [] to specify conditions.
library(data.table)
# Create a sample data.table
dt <- data.table(id = 1:10, value = c(5, 12, 8, 20, 15, 7, 25, 30, 10, 18))
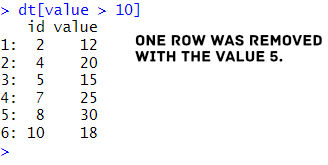
# Filter rows where value is greater than 10
dt[value > 10]Code language: R (r)In the code chunk above, we filtered rows where the column value is greater than 10 by directly applying the condition inside the square brackets. This approach eliminates the need for an additional filtering function, making it concise and efficient. Here is the result:
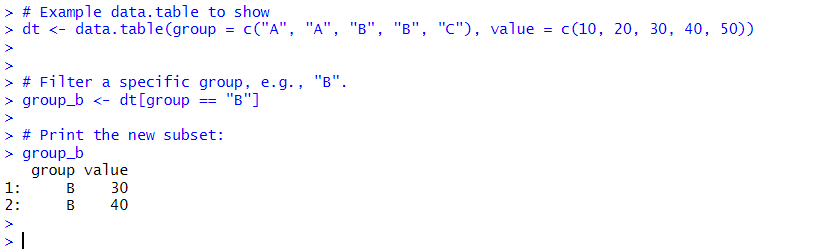
We printed the filtered results in the code chunk above without saving them. If we want to save this subset as a new data.table, we need to assign it to a new variable:
filtered_dt <- dt[value > 10]Code language: R (r)Naturally, we can also create subsets if we are intersted in specific groups within our data:
How to Filter data.table in R with Multiple Conditions
We can apply multiple conditions to refine our selection further.
# Filter rows where value is greater than 10 and id is even
dt[value > 10 & id %% 2 == 0]Code language: R (r)
Here, we filtered rows where value is greater than 10 and id is an even number. We used & to combine conditions, but we could also use | to filter rows that match at least one condition. Remember to save the new filtered data.table if needed.
Filter data.table with %in%
We can use the %in% operator to filter based on a set of specific values. Here is another way we can filter in data.table in R:
# Filter rows where id is in a specific set
dt[id %in% c(2, 4, 6, 8)]Code language: R (r)
In this example, we kept only the rows where id matches one of the values in the vector (2, 4, 6, 8). This approach is more readable and efficient than chaining multiple equality checks.
Filter data.table by Group
We can also filter data.table in R within groups using the by argument.
dt[value > mean(value), by = group]Code language: R (r)In the code chunk above, we filtered rows where value is greater than the mean value of their respective group. We used the by argument to calculate each group’s mean separately before applying the filtering condition.
Conclusion
It is easy to filter in data.table in R is quite simple. In this post, we have learned that we can use simple conditions, multiple conditions, the %in% operator, and even filter within groups using by. Compared to base R and dplyr, data.table provides a more concise and optimized approach to handling large datasets.
If you found this post helpful, consider sharing it with others who work with large datasets in R. Also, feel free to comment below if you have any questions or alternative filtering techniques!
Resources
Here is some more data.table tutorials: