In this guide, you will learn how to concatenate two columns in R. You will learn how to merge multiple columns in R using base R (e.g., using the paste function) and Tidyverse (e.g., using str_c() and unite()). In the final section of this post, you will learn which function is the best to use when combining columns.
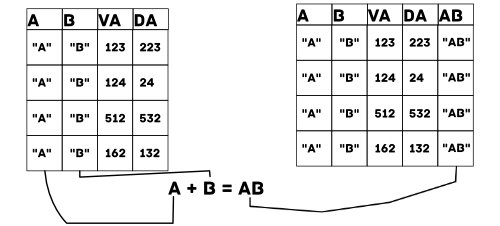
If you have some experience using dataframe (or, in this case, tibble) objects in R and you are ready to learn how to combine data found in them, then this tutorial will help you do precisely that.
Knowing how to do this may be helpful when you have a dataframe containing information in two columns and you want to combine these two columns into one using R. For example, you might have a column containing first names and last names. In this case, you may want to concatenate these two columns into one e.g., called Names.
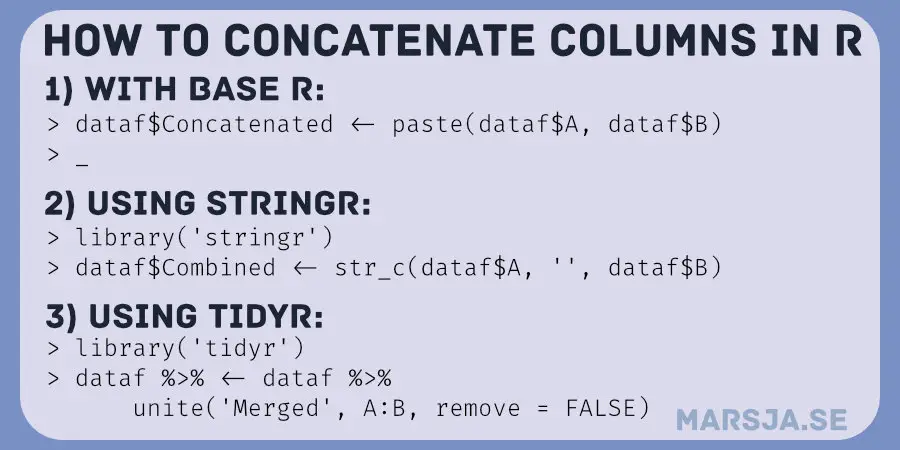
You can follow along with the examples in this tutorial using the interactive Jupyter Notebook found towards the end. Here is the example data we used to learn how to combine two or more columns into one variable. That said, in the following section you will find the outline of the post, followed by what you need to follow this post about how to concatenate in R.
Table of Contents
- Outline
- Requirements
- Reading Example Data from a .xlsx File
- Concatenate Two Columns in R
- Concatenate Two Columns with – as a separator in R
- Combine Multiple Columns in R
- Concatenate Two Columns in R with the str_c() Function (stringr)
- Merge Columns in R with the unite() Function (tidyr)
- Which Function is Best for Concatenating Columns in R?
- FAQ: Concatenate in R
- Conclusion
- R Resources
Outline
In this post, you will learn, by example, how to concatenate two columns in R. As you will see, we will use R’s $ operator to select the columns we want to combine. The outline of the post is as follows. First, you will learn what you need to have to follow the tutorial. Second, you will get a quick answer on how to merge two columns. After this, you will learn a couple of examples using 1) paste() and 2) str_c() and 3) unite(). In the final section, of this concatenating in R tutorial, you will learn which method I prefer and why. That is, you will get my opinion on why I like the unite() function. In the next section, you will learn about the requirements of this post.
Requirements
If you prefer base R, you do not need more than a working R installation. However, if you will use either str_() or unite(), you need to have at least one of the packages stringr or tidyr. It is worth pointing out here, that both of these packages are part of the Tidyverse package. This package contains multiple useful R packages that can be used for reading data, visualizing data (e.g., scatter plots with ggplot2), extracting year from date in R, adding new columns, among other things. Installing an R package is simple, here is how you install Tidyverse:
install.packages("tidyverse")Code language: R (r)Note, if you want to install stringr or tidyr, just exchange “tidyverse” e.g. “stringr”. In the next section, you will get a quick answer, without any details, on how to concatenate two columns in R. Remember to keep your R environment updated (i.e., run the latest version).
Before we have a more detailed look at how to use paste() to combine two columns, we will load an example dataset. Using this dataset, we can practice concatenating in R.
Reading Example Data from a .xlsx File
Here is how to read a .xlsx file in R using the readxl package:
# Importing Example Data:
library('readxl')
dataf <- read_excel("combine_columns_in_R.xlsx")Code language: R (r)
Now, we can have a look at the structure of the imported data using the str() function:

We will also have a quick look at the first five rows using the head() function:
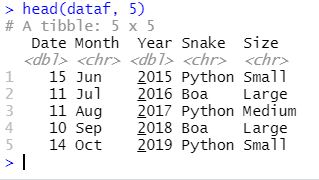
Now, in the images above, we can see that there are five variables and seven observations. That is, there are five columns and seven rows in the tibble. Moreover, we can see the types of variables, and we can, of course, also use the column names. In the next section, we will start by concatenating the month and year columns using the paste() function.
- R Count the Number of Occurrences in a Column using dplyr
- How to Create a Matrix in R with Examples – empty, zeros
Concatenate Two Columns in R
Here is one of the simplest ways to combine two columns in R using the paste(): function:
dataf$MY <- paste(dataf$Month, dataf$Year)Code language: R (r)In the code above, we used $ in R to 1) create a new column but, as well, selecting the two columns we wanted to combine into one. Here is the tibble with the new column, named MY:
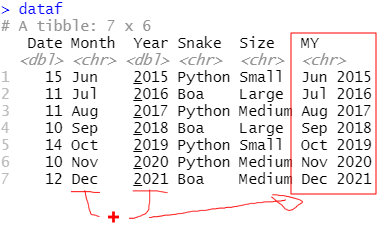
In the next example, we will merge two columns and add a hyphen (“-”), as well. In a recent post, you will learn how to remove a row in R using e.g., dplyr. For more useful operators, and how to use them, see for example the post “How to use %in% in R: 7 Example Uses of the Operator“.
Concatenate Two Columns with – as a separator in R
Now, to add “-” (hyphen) between the values we want to combine, we add a third parameter to the paste() function:
dataf$MY <- paste(dataf$Month, "-", dataf$Year)Code language: R (r)In the code example above, we used the sep parameter and set it as “-”. As you can see, in the image below, we have whitespaces between the two values (i.e. “Month” and “Year”).
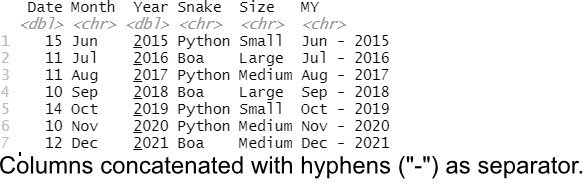
Now, using R’s paste() function, we can add another parameter: the sep parameter. Here is a code example combining the two columns, adding the “-” without the whitespaces:
dataf$MY <- paste(dataf$Month, dataf$Year, sep= "-")Code language: R (r)Notice that instead of pasting the hyphen, we used it as a separator. Before moving on to the next example, it is worth pointing out that if we don’t want to add whitespace, we can use the paste0() function instead. This way, we don’t need the sep parameter. In the following example, we will look at how to combine multiple columns (i.e., three or more) in R.
Combine Multiple Columns in R
As you may have understood, combining more than two columns is as simple as adding a parameter to the paste() function. Here is how we combine three columns in R:
dataf$DMY <- paste(dataf$Date, dataf$Month, dataf$Year)Code language: R (r)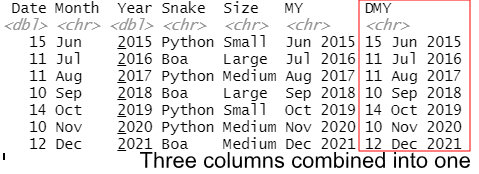
That was also pretty simple. It is worth mentioning that if you use the sep parameter, in a case as above, you will end up with whatever character you choose between each value from each column. For example, if we were to add the sep argument to the code above and put underscore (“_”) as a separator, here is how the resulting tibble would look like:
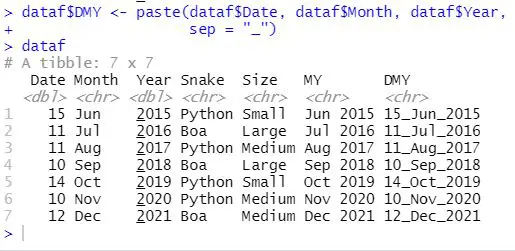
You may understand that using the sep parameter lets you use almost any character to separate your combined values. In the next section, we will look at the str_c() function from the stringr package.
Concatenate Two Columns in R with the str_c() Function (stringr)
Combining two columns with the str_c() function is super simple. Here is how to merge the columns “Snake” and “Size” using the str_c() function:
library(stringr)

dataf$SnakeNSize <- str_c(dataf$Snake," ", dataf$Size)Code language: PHP (php)
Notice that we added something between the two columns we wanted to concatenate? When working with this function, we need to do this, or else we end up with nothing separating the two values we are combining. As previously mentioned, the stringr package is part of the Tidyverse packages which also includes packages such as tidyr and the unite() function. In the next section, we are going to merge two columns in R using the unite() function as well.
- You may also like: How to Add a Column to a Dataframe in R with tibble & dplyr
Merge Columns in R with the unite() Function (tidyr)
Here is how we concatenate two or more columns using the unite() function:
library(tidyverse) # or library(tidyr)

dataf <- dataf %>%
  unite("DM", Date:Month)Code language: R (r)
Notice something in the code above. First, we used a new operator (i.e., %>%). Among many things, this enables us to use unite() without the $ operator to select the columns. As you can see, we used two parameters in the code example above. First, we name the new column we want to add (“DM”), second, we select all the columns from “Date” to “Month” and combine them into the new column. Here is the resulting dataframe/tibble:

As you can see in the image above, the combined columns have disappeared. If we want to keep the original columns after concatenating them, we can set the remove parameter to FALSE. Here is a code chunk that you can use instead not to remove the columns:
dataf <- dataf %>%
  unite("DM", Date:Month, remove = FALSE)Code language: R (r)
Finally, did you notice how we have an underscore as a separator? If we want to change to another separator, we can use the sep parameter. This is exactly what we will do in the next example:
Concatenate two Columns in R using “-” as a separator
Here is how we use the unite() function together with the sep parameter to change the separator to “-” (hyphen):
dataf <- dataf %>%
  unite("DM", Date:Month, sep= "-",
        remove = FALSE)Code language: R (r)
That was as simple as the previous example. In the next section, you will learn which function I prefer to use and why.
Which Function is Best for Concatenating Columns in R?
Naturally, this section will contain my opinion. I have not done any optimization testing (e.g., I do not know which function is the fastest for combining columns in R). Although all of the functions used in this post are simple, I prefer the unite() function. Why? Well, together with the piping operator, I think it makes the column very readable. It is also convenient to use unite() if you are going to concatenate multiple columns in R. As you may have noticed, in the examples above, we can use “:” when combining columns. This means that we can merge multiple columns from the first column (i.e., left of the column sign) to the last column (i.e., right of the “:”). This is pretty neat, saving some space in your code and making it easier to read!
Another neat thing is that we add the new column name as a parameter and automatically eliminate the columns combined (if we don’t need them later, of course). Finally, we can also set the na.rm parameter to TRUE if we want missing values to be removed before combining values. Here is a Jupyter Notebook with all the code in this post.
FAQ: Concatenate in R
To concatenate two columns, you can use the paste() function. For example, if you want to combine the two columns A and B in the dataframe df you can use the following code: df[‘AB’] <- paste(df$A, df$B). However, using paste will result in a whitespace between the values in the new column.
To combine columns in R, you can use the paste() function, like this: combined_column <- paste(df$column1, df$column2, sep = " ").
To combine two columns in R with NA values, you can use the paste() function along with ifelse() to handle the NA values like this: combined_column <- ifelse(is.na(df$column1), df$column2, ifelse(is.na(df$column2), df$column1, paste(df$column1, df$column2, sep = " "))).
Conclusion
In this post, you have learned how to concatenate two (or more) columns in R using three different functions. First, we used the paste() function from base R. Using this function, we combined two and three columns and changed the separator from whitespaces to hyphen (“-”). Second, we used the str_() function to merge columns. Third, we used the unite() function. Of course, it is possible (we saw some examples) to change the separator using the two last functions as well. To conclude, the unite() function seems to be the handiest function to concatenate columns in R.
I hope you learned something! If you did, please leave a comment below, share on your social media, include a link to the post on your projects (e.g., blog posts, articles, reports), or become a Patreon:
Finally, if you have any suggestions or other comments, or if there is something you wish me to cover, do not hesitate to contact me.
R Resources
- How to Calculate Five-Number Summary Statistics in R
- Learn How to Calculate Descriptive Statistics in R the Easy Way with dplyr
- How to Rename Column (or Columns) in R with dplyr
- R: Add a Column to Dataframe Based on Other Columns with dplyr
- How to Add an Empty Column to a Dataframe in R (with tibble)
- How to Create a Sankey Plot in R: 4 Methods

First, let me say that your examples are very good and the way you organize the content of your pages makes it easy to follow. I follow this code in your example: “dataf$DMY <- paste(dataf$Date, dataf$Month, dataf$Year)" to get a new column using the text in two other columns. It kind of worked – it created the column and used the categorical identifiers in the two columns, however it added a space in between the two. I need no space in between. How do I modify the new column to eliminate the space. Or how can I modify the code to get the new variable without the space.
Hey Jamille,
Thank you for your kind comment. When merging the columns, using
paste(), you can add thesepargument. For example,dataf$DMY <- paste(dataf$Date, dataf$Month, dataf$Year, sep = "")will result in "10092021". Alternatively, you can usepaste0(). Removing whitespaces can be done in many ways, of course. But you can usegsub(), for instance. Here's an example that should work:dataf$DMY <- gsub(pattern = "\s", replacement = "", x = dataf$DMY)but I haven't tested it. Hope it helps,Erik