In this short R tutorial, you will learn how to add an empty column to a dataframe in R. Specifically, you will learn 1) to add an empty column using base R, 2) to add an empty column using the add_column function from the package tibble and we are going to use a pipe (from dplyr). Now, dplyr comes with many handy functions that, apart from adding columns, make it easy to remove a column from the R dataframe (e.g., using the select() function). Both tibble and dplyr are part of the tidyverse package.
The outline of this post is as follows:
- Reading Data from an Excel File
- How to Add an Empty Column to the Dataframe with:
- Base R
- add_column()
- How to Add Multiple Empty Columns with:
- Base R
- add_column()
First, before reading the .xlsx file I will go through what you need to follow this post. After that, you’ll find a syntax answering the question, “How do I add an empty column to a DataFrame in R?”. in the next section, we will get into more details about adding columns. Now, in all the examples, we will cover how to insert empty strings or missing values, as both could be considered being empty.
Prerequisites
It would be best if you had R installed to follow this tutorial. Furthermore, if you want to add a column using tibble (and dplyr), you must install these packages. Finally, if you are going to read the example .xlsx file you will also need to install the readr package. Note, however, that if you install the tidyverse package you will get tibble, dplyr and readr.
I would highly recommend installing tidyverse as you can also easily calculate descriptive statistics, visualize data (e.g., scatter plots with ggplot2), among other things. Installing the r packages can be done using the install.packages() function:
install.packages(c('tibble', 'dplyr', 'readr'))Code language: R (r)If you want to install tidyverse just type install.packages('tidyverse') instead. Another great package, part of the tidyverse package, is lubridate. If you are working with time series data this package can be used to use R to extract year from date but also to extract day and to extract time. Now that you should be set with these useful packages, we can start reading an Excel file and add columns. But first, let’s give a short answer to the question that may have brought you here:
Finally, before we read the example date, it may be worth mentioning that we can also use R to add a column to a dataframe based on conditions of other columns.
Reading Data from an Excel (.xlsx) File
Now, before getting into more detail on how to append a column we will read some example data using readxl:
library(readxl)
dataf <-  read_xlsx('example_sheets.xlsx',
                    skip = 2)Code language: R (r)
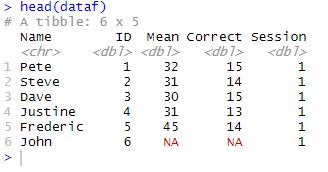
In the code chunk above, we used the readxl package in R to read data from an Excel file called “example_sheets.xlsx“. Moreover, we skip the first two rows of the spreadsheet and store the remaining data in a data frame called dataf.
To use the readxl package, you must first load it into your R session using the library() function. Then, you can use the read_xlsx() function to read an Excel file. The skip parameter allows you to specify how many rows to skip at the beginning of the spreadsheet. Here are the first five rows of the imported data:
As a quick note; it is, of course, possible to import data from other formats. If you need to, here are a couple of tutorials on how to read data from SPSS, Stata, and SAS:
- How to Read and Write Stata (.dta) Files in R with Haven
- How to Import Data: Reading SAS Files in R
- How to Read & Write SPSS Files in R Statistical Environment
Now that we have some example data, we can go on by adding a column first using base R and, then, by using add_column(). After that, we’ll also add multiple columns using both methods. As you may understand, appending an empty column is a task done, more or less, the same way as when we add a column to a dataframe in R.
How to Add an Empty Column to a Dataframe in R in Two Ways
This section will look at two methods adding empty columns to an R dataframe. First, we’ll use base R:
1 Adding an Empty Column using Base R
Here’s how to insert an empty column (i.e., containing missing values) to the dataframe:
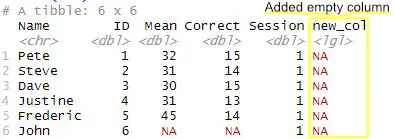
dataf['new_col'] <- NACode language: R (r)In the code chunk above, we add a new column to a dataframe called dataf and fills it with missing (NA) values.
To add a new column to a data frame, you can use the square bracket notation with the name of the new column inside quotes. In this case, the new column is called “new_col” and is empty (or contains NA).
Here’s the dataframe with the added empty column:
In the next example, we will add NA to a new column using tibble’s add_column(). If you need to, you can also generate a sequence of numbers in R e.g. using the rep() function.
2 Inserting an Empty Column using add_column()
To add an empty column (i.e., NA) to a dataframe in R using add_column() we do as follows:
library(tibble)
library(dplyr)

dataf <- dataf %>%
  add_column(Empty_Col = NA)
head(dataf)Code language: R (r)
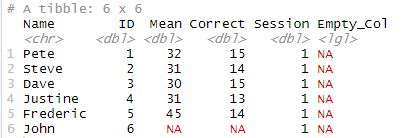
In the code chunk above, we start by loading the two R packages – tibble and dplyr – and we added a new column called “Empty_Col” to an existing data frame called dataf.
Next, the add_column() function from the dplyr package is used to add the new column to the dataframe. The second argument of add_column() specifies the default value for the new column, which is NA in this case. Finally, we used the %>% operator that is known as the “pipe” operator- The pipe operator is used to chain together multiple functions in a way that makes the code more readable. In this case, we are using the pipe operator to pass dataf to the add_column() function.
In the above example, we created a new dataframe object. If you, on the other hand, want to add a column and create a new dataframe you can change the code. For instance, changing dataf to dataf2 to the left of the <- would do the trick.
Noteworthy, there are two interesting arguments that we can work with if we want to insert the new column at a specific location.
These two arguments are .before and .after. If we, for example, want to add an empty column after the column named “Mean” we add the .after argument like this:
dataf <- dataf %>%
  # Creating an empty column:
  add_column(Empty_Col2 = NA, .after="Mean")
head(dataf)Code language: PHP (php)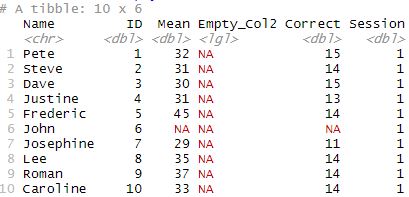
Finally, if we don’t want to work with dplyr we can add the dataframe as the first argument:
library(tibble)
library(dplyr)

dataf <- add_column(dataf, Empty_Col = NA)Code language: R (r)
Now that you have added an empty column to the dataframe, you might want to create dummy variables in R (e.g., if you have categorical variables).
How to Add Multiple Columns to a Dataframe
In this section, which is similar to the first section, we will be adding many columns to a dataframe in R. Specifically, we will add 2 empty columns using base R and the add_column() (tibble). As you might understand, after you have looked at the examples, inserting more columns is just repeating or adding to the code. Note we use the same example dataframe as in the previous example.
1 Adding Multiple Empty Columns with Base R
Here’s how to add multiple empty columns with base R:
dataf['new_col1'] <- NA
dataf['new_col2'] <- NACode language: CSS (css)
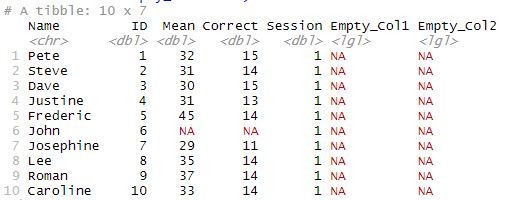
As in the previous example, we used the brackets and set the new column name between them (i.e., ‘new_col1’). The second empty column was added the same way but with a unique name. Here is how to dataframe looks like with the two empty columns added:

2 Adding Multiple Columns with the add_column() function
Here’s how to add multiple columns using add_column():
dataf <- dataf %>%
  add_column(Empty_Col1 = NA,
             Empty_Col2 = NA)Code language: R (r)
Again, we can decide where in the dataframe we want to add the empty columns by using either the .after or .before arguments (see the example for adding an empty column). If you need to add 3 or 5 (or more) columns, you just add the column names for them and what they should contain.(e.g., NA for empty). If you want to create an environment so that other people can test, run, and use your code the exact same way you could, you could use binder and R for reproducible code.
Note, whether you add one or multiple empty columns you need to make sure that you use a new, and unique column name for each column. If you don’t, you might overwrite your data. Note, you could also add new columns to the dataframe creating data using the repeat and replicate functions in R.
Conclusion: Add an Empty Column to a Dataframe in R
In this post, we learned how to add empty columns to a dataframe in R. Specifically, we used base R and tibble (add_column()). First, we added a single empty column by simply assigning NA to it. Second, we used the function add_column() with the new column name as an argument and NA as input. Finally, we used the two methods also to learn how to add multiple columns to the dataframe.
Hope you enjoyed the R tutorial, and please leave a comment below if there is something you want to be covered, in general, on the blog, as well as in this blog post. Finally, please share the post if you learned something new!
Other R Posts that you will Find Useful
- How to Extract Time from Datetime in R – with Examples
- Repeated Measures ANOVA in R and Python using afex & pingouin
- How to Extract Day from Datetime in R with Examples
- Reverse Scoring using R Statistical Environment
- How to Create a Sankey Plot in R: 4 Methods
- Correlation in R: Coefficients, Visualizations, & Matrix Analysis
