In this short tutorial, you will learn how to convert a matrix to a dataframe in R. Specifically, you will learn how to use base R and the package tibble to change the matrix to a dataframe. You will learn this task using four examples (2 using each method).
Table of Contents
- Outline
- Installing tibble or Tidyverse
- Example Data
- Example 1: Converting a Matrix to a Dataframe with Base R
- Example 2: Convert Matrix to Dataframe in R & adding Column Names
- Example 3: Converting a Matrix to a Dataframe in R using Tibble
- Example 4: Convert Matrix to Dataframe in R with Tibble and Setting Column Names
- Conclusion
- Resources
Outline
This post is structured as follows. First, you will learn briefly about tibble and how to install this R package. After this, you will get the answer to the question, “How do I convert a matrix to a dataframe in R”. In the next section, we will create a simple matrix. The following sections, of the blog post, will be converted to a dataframe in different examples throughout the post. These examples will, hopefully, deepen your knowledge concerning converting matrices in R.
In the first example, we will use base R to convert the matrix. Subsequently, we will add column names when converting the matrix to a dataframe.
In the third example, we will then use tibble and the function as_tibble() to change the matrix to a dataframe (i.e. a tibble object). Finally, we will also use tibble and setNames() when converting a matrix to a dataframe. In the next example, you will learn how to install tibble or Tidyverse.
Installing tibble or Tidyverse
Here’s how we can instal tibble:
install.packages("tibble")Code language: R (r)As usual, we use the install.packages() function and write the package (i.e., “tibble”) within quotation marks. Note that we can install the Tidyverse package. This package contains the tibble among other useful packages. We can, for example, use the Tidyverse package remove duplicates, and rename factor levels. Moreover, the package tibble can be used to add empty columns to the dataframe, add new columns to the dataframe, and much more.
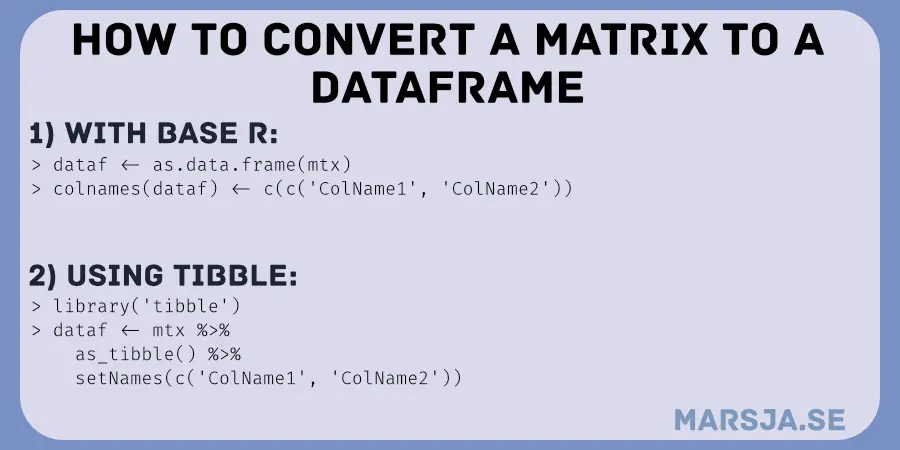
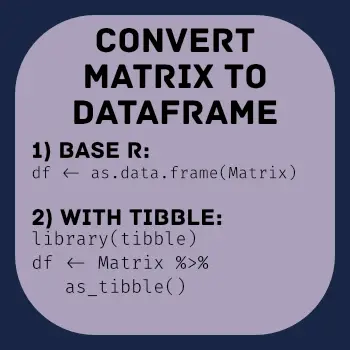
To convert a matrix to a dataframe in R, you can use the as.data.frame() function, For example, to change the matrix, named “MX”, to a dataframe you can use the following code: df_m <- as.data.frame(mtx).
In the next section, we are going to create a matrix using the matrix() function.
Example Data
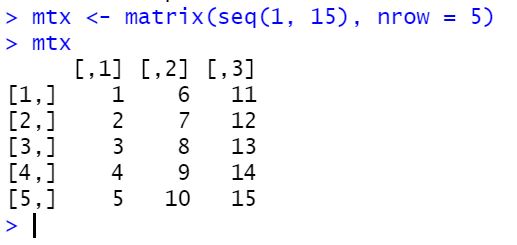
Before we change a matrix to a dataframe, we will need to create a matrix. Here is how we can create a matrix in R using the matrix() function:
mtx <- matrix(seq(1, 15), nrow = 5)Code language: HTML, XML (xml)In the code above, we used the seq() function to generate a sequence of numbers (i.e., from 1 to 15). Moreover, we also created 5 rows, using the nrow argument. Here’s the resulting matrix:
In the next section, we will have a look at the first example of converting the matrix, we have created, to a dataframe.
Example 1: Converting a Matrix to a Dataframe with Base R
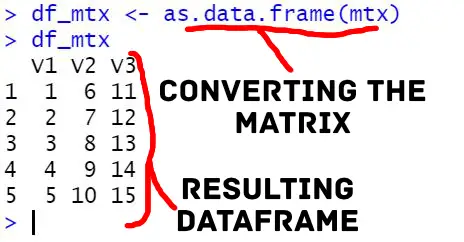
To convert a matrix to a dataframe in R we can use the as.data.frame() function:
df_mtx <- as.data.frame(mtx)Code language: R (r)In the code above, we simply used the function (i.e., as.data.frame()) to create a dataframe from the matrix. Here is the converted dataframe:
Now that we have converted the matrix to a dataframe, we can use e.g., the str() function to look at the structure of the data:
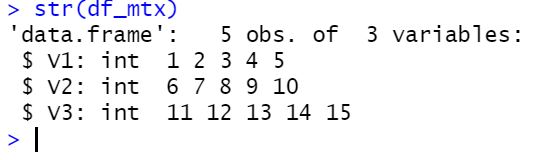
As you can see, in the output above, we have 3 columns of the data type integer. This is, of course, expected (we created a sequence of numbers as a matrix). Notice how we have the column names V1 to V3. This is not that informative, and there are a number of options here. First, we could name the columns in the matrix (or when creating the matrix). Second, we can rename the columns of the created dataframe. In this post, we will change the column names after we have converted the matrix.
Example 2: Convert Matrix to Dataframe in R & adding Column Names
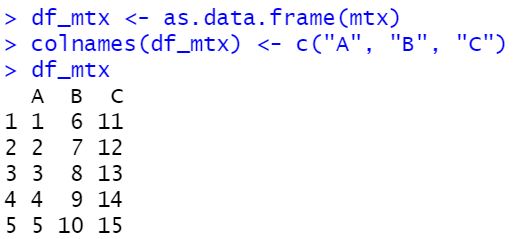
Now, after converting the matrix, using the as.data.frame() function, we can use the colnames() function:
df_mtx <- as.data.frame(mtx)
colnames(df_mtx) <- c("A", "B", "C")Code language: JavaScript (javascript)
In the code chunk above, we used the colnames() function and assigned a character vector. This character vector contained the three column names. Here’s the converted matrix (i.e., the dataframe):
It is also possible to convert a list to a dataframe in R. In the next example, we will continue using an installed R package: tibble.
Example 3: Converting a Matrix to a Dataframe in R using Tibble
In this section, you will learn how to use another package for converting a matrix to a dataframe: tibble. Here’s how to transform a matrix to a dataframe in R using tibble:
library(tibble)
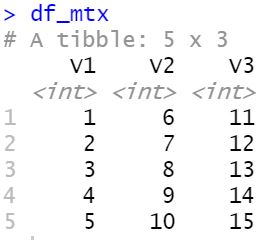
df_mtx <- mtx %>%
as_tibble()Code language: HTML, XML (xml)As you probably notice, there is a difference in how we, now, use the function. Instead of adding the matrix within the parentheses, as in the previous two examples, we used the pipe operator (“%>%”). On the left side of pipe operator we had the matrix, the new dataframe, and on the right side we use the function. Here’s the dataframe that we have created from the matrix:
Here are some blog posts about other useful operators:
- How to use %in% in R: 7 Example Uses of the Operator
- How to use $ in R: 6 Examples – list & dataframe (dollar sign operator)
Now, most of the time we would like to have better column names than what we get in this example. As previously mentioned, we could have set the column (and row names) when we created the matrix. However, if we already had a matrix without names but we knew the column names we can use the setNames() function together with another pipe. This is what we will have a look at in the final example.
Example 4: Convert Matrix to Dataframe in R with Tibble and Setting Column Names
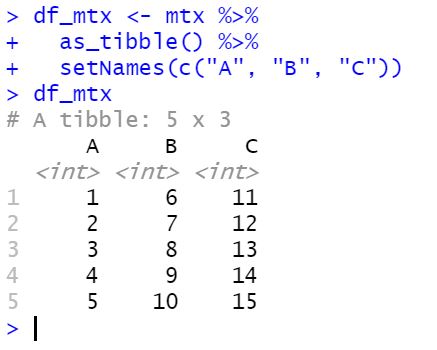
Here’s how we can convert a matrix to a dataframe and set the column names:
df_mtx <- mtx %>%
  as_tibble() %>%
  setNames(c("A", "B", "C"))
  Code language: JavaScript (javascript)
In the code chunk above, we used another pipe (see Example 3) and added the function setNames() to add the column names “A”, “B”, and “C”. Here’s the resulting dataframe:
As previously mentioned, tibble is part of the Tidyverse and this means that we could have used dplyr to rename the columns after we created the dataframe. Now that you have converted your matrix to a dataframe, you might want to delete a row (or two) in R using e.g. dplyr.
Conclusion
In this post, we have converted a matrix to dataframe in R. More specifically, we have learned how to carry out this task by following 4 different examples. In the first two examples, we used base R. In the final two examples, on the other hand, we will use the Tidyverse package tibble. Whether we use base R or Tibble to convert matrices to dataframes, we need to set the column names. That is, if the matrix we convert does not have column names. I hope you learned something valuable in this tutorial.
If you have anything you would like me to cover in a blog post (e.g., something you need to learn) please comment below. For any suggestions or corrections, please drop a comment below, as well.
Resources
Here are some resources you might find helpful:
- How to use %in% in R: 8 Example Uses of the Operator
- Z Test in R: A Tutorial on One Sample & Two Sample Z Tests
- How to Create Dummy Variables in R (with Examples)
- Master or in R: A Comprehensive Guide to the Operator
- How to Standardize Data in R
- Probit Regression in R: Interpretation & Examples
- How to Calculate Z Score in R